Platform Analytics
Track throughput, failures, and latency to keep SyncMyOrders running smoothly.
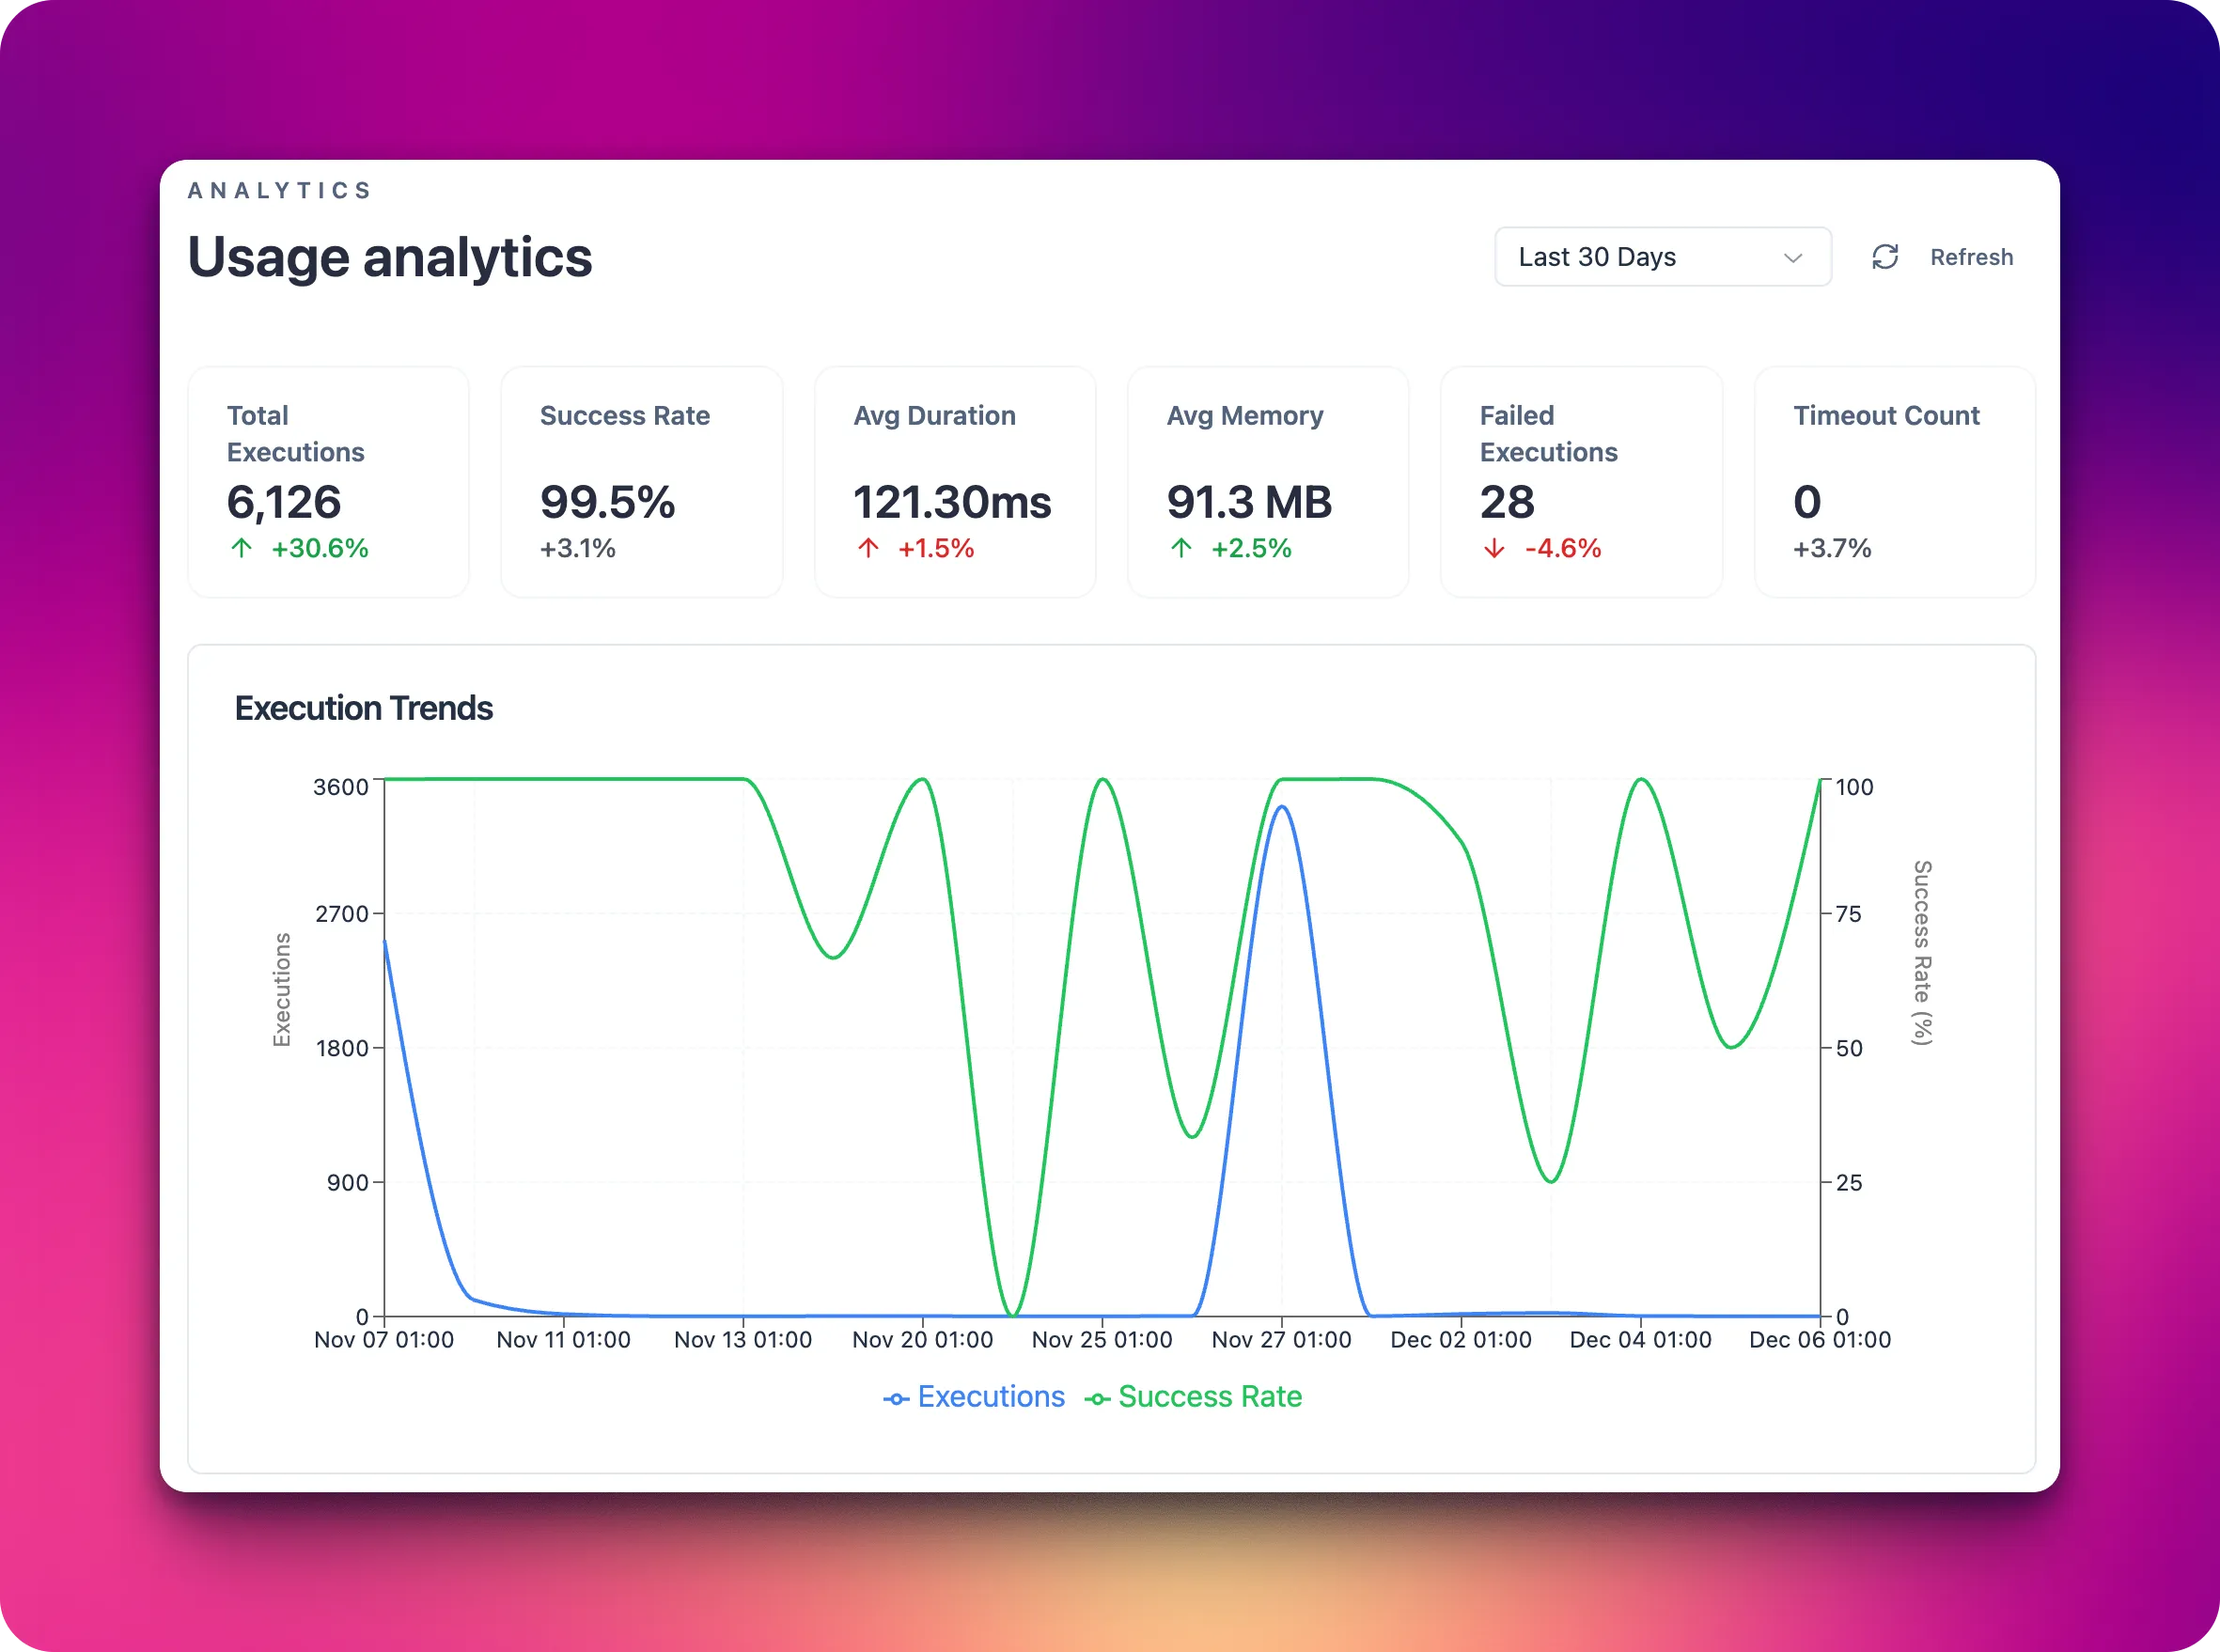
Platform analytics surfaces how your automations perform over time. Use it to spot slowdowns, error spikes, or volume changes before they impact customers or partners.
What you can monitor in the Usage analytics
- Scenario run volume and success rates by day or channel.
- Latency for critical paths like order intake, fulfillment routing, and customer notifications.
- Error types grouped by agent, capability, or connection.
- Trigger health for schedules and webhooks to confirm events are still flowing.
Practical uses
- Establish baselines for peak hours and alert when throughput drops unexpectedly.
- Prioritize reliability work by focusing on the agents or connections with the highest failure counts.
- Validate the impact of new deployments by comparing pre- and post-release metrics.
- Share trends with support and operations so they can inform merchants or partners proactively.
System
The System section shows how loaded the underlying infrastructure is while your scenarios run. Use it when you see slow responses, timeouts, or rising error rates without obvious changes in scenario logic.
CPU
- What it is: the percentage of processor capacity currently used to handle your automations.
- Why it matters: helps you see whether there is enough compute capacity for the current volume of requests and scenario runs.
- What you see: current CPU usage (in %) and average values for the selected time range.
- What affects it:
- more concurrent scenario runs;
- heavy operations (complex data transformations, large loops, intensive API calls);
- traffic spikes during peak business periods (sales, campaigns, promotions).
Memory
- What it is: the amount of RAM used by your scenarios and platform subsystems.
- Why it matters: helps you spot memory leaks, overly heavy scenarios, or risks of performance degradation.
- What you see: memory usage in MB/GB and as a percentage of available memory.
- What affects it:
- processing large payloads (orders with many line items, deeply nested JSON structures);
- running many steps or scenarios in parallel;
- caching data inside custom components.
Disk
- What it is: disk space used by the platform (logs, temp files, processing outputs).
- Why it matters: prevents issues when free space runs low and starts impacting scenario stability.
- What you see: used disk space (in GB) and percentage of total capacity.
- What affects it:
- growing log volume from many runs or very detailed logging;
- storing large exports, attachments, or temporary files;
- keeping historical data for long periods without cleanup.
If CPU/Memory/Disk stay high over time, you should:
- review how often scenarios run and how complex they are;
- optimize data processing (filtering, aggregations, smaller payloads);
- adjust logging levels or set up stronger retention and cleanup policies.
Rate limits
The Rate limits page helps you understand how your integrations consume external system quotas and how close they are to technical limits. It is a key tool for preventing throttling, API bans, and performance degradation during peak traffic or bulk operations.
What you can see on the Rate limits page
- Per-connection overview: a list of connections (Shopify, HTTP, Database, LLM, SFTP) with their current usage versus allowed quota (for example, requests per minute, calls per hour, or concurrent sessions).
- Usage over time: charts that show how many calls were made in a given time window, the average utilization of the limit, and short-term bursts.
- Visual indicators: visual cues (colors, badges, or percentage bars) that show how much capacity remains before a limit is reached.
- Throttle and error signals: counts of requests that were delayed, retried, or failed specifically due to rate limiting.
- Scenario impact: aggregated metrics that show which scenarios contribute most to rate usage for a given connection.
Connection types and how they are measured
- Shopify connections:
- measured in API calls against Shopify’s REST/GraphQL limits (requests per second or per time bucket);
- includes actions like order sync, inventory updates, price changes, and fulfillment status updates;
- spikes typically come from bulk imports, catalog updates, or backfills.
- HTTP connections:
- measured in outbound HTTP requests to third-party or internal APIs;
- includes webhook deliveries, REST calls, and polling-based integrations;
- sensitive to loops, frequent polling intervals, and multi-step scenarios calling the same endpoint.
- Database connections:
- measured in queries per second/minute and concurrent connections;
- includes SELECT/INSERT/UPDATE/DELETE operations triggered by scenarios;
- affected by batch sizes, inefficient queries, and parallel scenario executions.
- LLM connections:
- measured in calls per minute and, where exposed by the provider, token usage;
- includes prompt-based operations (classification, rewriting, summarization, decision support);
- sensitive to long prompts, large output sizes, and fan-out patterns where many calls are made in parallel.
- SFTP connections:
- measured in file operations over time (uploads, downloads, listings, deletions) and concurrent sessions;
- includes scheduled imports/exports, nightly jobs, and ad hoc file processing;
- affected by large batch transfers, frequent directory scans, and high file churn.
What affects rate limit usage
- Scenario frequency: how often triggers fire (schedules, webhooks, event streams). More frequent runs mean more calls against your limits.
- Scenario design: the number of steps that call external systems (Shopify, HTTP APIs, databases, LLMs, SFTP servers) and whether they run sequentially or in parallel.
- Batching and pagination strategy: small page sizes or unbatched item processing can significantly increase request counts.
- Retry and error handling: aggressive retry policies can quickly consume limits when a downstream system is unstable.
- Backfills and bulk operations: historical re-syncs, exports, or mass updates create short-term surges that may hit limits even if average usage is low.
Use the Rate limits page together with run history and scenario logs to pinpoint which flows are driving limit consumption and where to optimize (for example, increasing batch sizes, reducing polling, or staggering heavy jobs).
Next steps
- Decide which metrics matter most for your business (e.g., order-to-ship time, webhook success rate).
- Set alerts on leading indicators rather than waiting for failed orders to pile up.
- Pair analytics with invocation history for drill-down into specific incidents.